Lag or Latent Phase
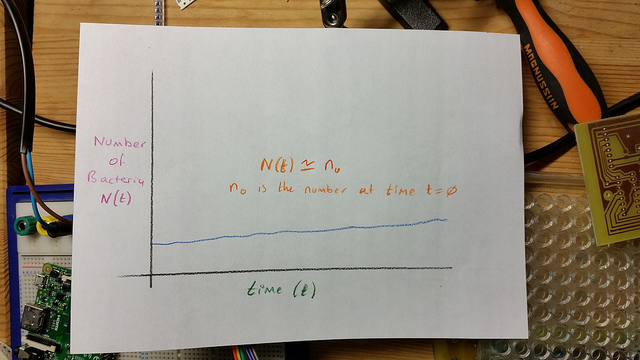
Lag phase
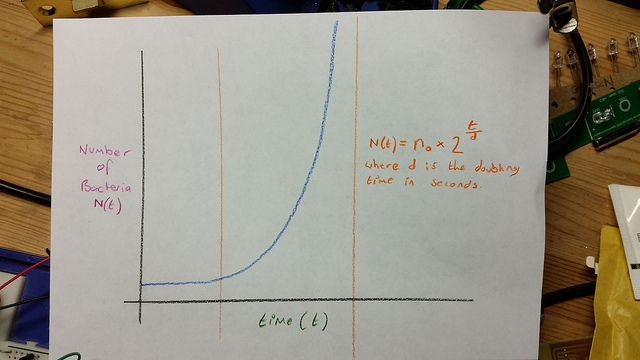
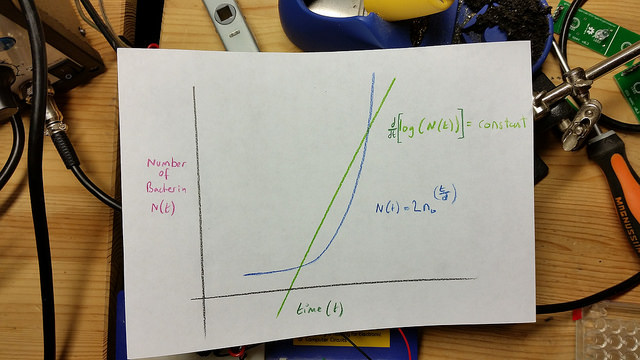
Exponential or “Log” phase
After a period of time, which depends on many factors including the strain/species and state of the external environment, including temperature and media constituents, the bacteria exhibit a change in reproductive behavior. Each bacteria becomes fully committed to reproduction by division to produce daughter cells, and those progeny cells are also committed to doubling as long as conditions remain favorable. These cells proceed to produce grand daughter cells following an approximate doubling time. This constant doubling time produces an exponentially increasing population count for the bacteria.
OD600
The higher the concentration of bacterial in a liquid culture, the higher the optical density of that culture when measured. Organic material has high optical density at light with wavelength 600 nanometres, and light at this wavelength is in the middle of the visible wavelength and easy to produce as measure. The optical density of a sample at 600 nanometres is referred to as OD600. The measured OD600 of the sample relative to a plain reference sample, gives an estimate of the concentration of the cells in the liquid, which can be used to estimate the growth phase of the population.
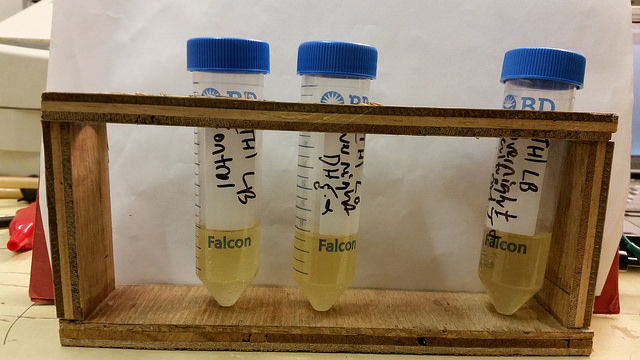
The basic idea is to compare a sample of plain media, and a sample of media in which bacteria has been growing. Initially the levels of bacteria will be very low, and the amount of light absorbed by the 2 samples will be similar.
|
|
|

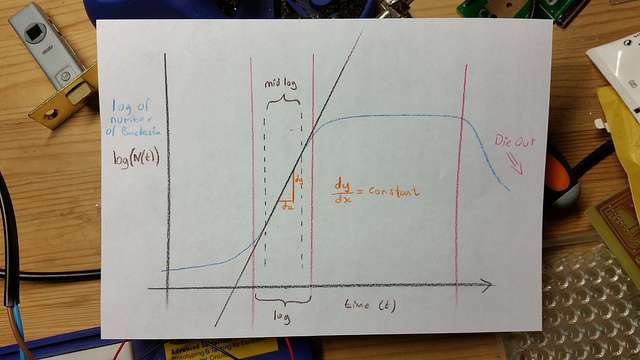
The 2 samples are then placed in an incubator, and over time as the number of bacteria grow, this relative value will change according to the growth phase of the bacteria. At the beginning the OD600 measures close to zero, because the bacterial population in is the early lag growth phase, and there are few bacteria in total. Reproduction accelerates, and the bacteria are at their most reproductive during the log or exponential phase, which usually corresponds to 0.5-0.6 OD600. Beyond these values, the bacterial population will stabilize and then decline.

Beyond the stationary phase, the OD600 will continue to increase, and the media will darken, but this is mostly due to large numbers of dead bacteria in the mixture. Populations of bacteria at this phase can be used to inoculate a fresh culture, but are generally useless for competency.
Wavelengths of light
600nm is in the visible wavelength an is approximately orange. These are some 605nm LEDs from ebay. 600nm light is preferred to UV for example, because its much less phototoxic at those energies. It is also a wavelength at which organic materials readily absorb light.


(Image: http://kids.britannica.com/comptons/art-57434/When-white-light-is-spread-apart-by-a-prism-or)
OD600 device
The idea is to make a cheap, robust, reliable hand held device that would do OD600 within the requirements of a diybio lab. The initial brain storming is to take a broad wavelength source of light which includes plenty of 600nm and use a 600nm BP filter and a level detector, and calibrate it to match 0.4 at OD600 on a proper spectrophotometer.
v0.1

The initial attempt was to use a white led with a filter for something approximating 600nm


At the moment the main issue is that the LDR (light dependent resistor) only sees about 20 ohms of difference between the initial inoculation and the mid-log phase, which shows as 0.4 OD600 on a spectrophotometer.
It really needs some amplification and a lot more light shielding.
v0.2
the second idea (once the 605nm LEDs had turned up from ebay);


Other stuff
If you don’t have access to a spectrophotometer, (or even if you do), this should be a convenient way to estimate OD600 values for your sample
A secondary project is to cast some 12mm x 12mm resin blocks to be used for calibration against a system that takes a cuvette.
Here is a document describing various methods for calibrating spectrophotometers;
http://www.perkinelmer.co.uk/CMSResources/Images/44-136839TCH_Validating_UV_Visible.pdf
alternative ideas
use a stain that binds to a protein that is only expressed during exponential growth phase
DNA Pol II is only expressed during the stationary period of growth, and so might be used as a marker for the end of exponential growth
omp regulates response to osmolarity is expressed in postexponential phase; (Connell et al 1987)
references
What you need to know about OD600 http://bitesizebio.com/1005/what-you-need-to-know-about-od600/
http://www.researchgate.net/post/How_to_exactly_determine_the_OD600_of_Ecoli_suspension
Open Source Spectrophotometer projects
Cambridge iGEM 2010 E.glometer
“We designed and built a low cost electronic system for measuring light output, this is useful for reporter assays.”
http://2010.igem.org/Team:Cambridge/Tools/Eglometer
OSS Spectrophotometer
https://github.com/lopenlab/OSS-Spectrophotometer
Aachen OD/F device
“Measuring Optical Density (OD) or absorbance is one of the indispensable elements in the field of microbiology. One question that has to be answered often is how many cells are in a suspension? Here, the OD can give a hint. However, the commercially available OD meters are expensive and limit its application and usage in low budget institutions.
Therefore, here we present our OD/F Device. The device is specifically designed for biohackspaces, Do It Yourself (DIY), community laboratories and schools. With our OD/F Device, we aim to enable precise and inexpensive scientific research.”
http://2014.igem.org/Team:Aachen/OD/F_device
components of device;
http://2014.igem.org/Team:Aachen/Notebook/Engineering/ODF#diy
Commercial Spectrophotometers
The procedure is normally carried out using a visible light capable spectrophotometer like this one;
|
|
|


But one of these, the are not that expensive?
http://www.laboratory-equipment.com/laboratory-equipment/cell-density-meter.php